Advances in Animal and Veterinary Sciences
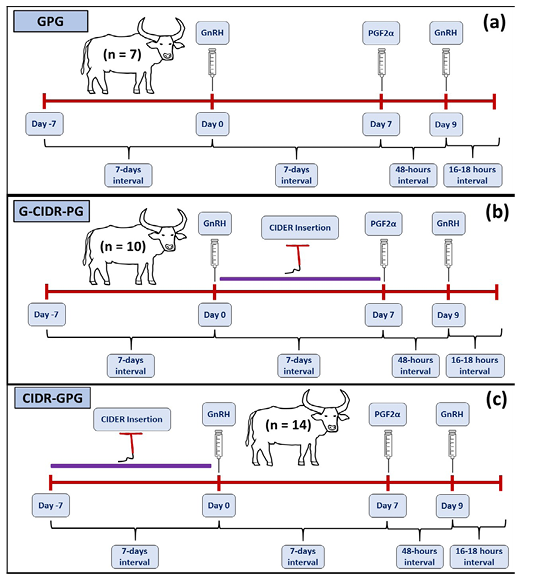
Ovsynch and modified ovsynch synchronization protocols show the GnRH-PGF2α-GnRH (GPG) ovsynch program with GnRH administration only at day 0 (A), GnRH-CIDR-PGF2α-GnRH (G-CIDR-PG) synchronization program with GnRH at day 0, CIDR insertion for 7 days from day 0 to 7 (B), and CIDR-GPG synchronization program with CIDR insertion for 7days from day -7 to 0, GnRH at day 0 (C), followed by PGF2α at day 7, GnRH at day 9, and timed artificial insemination after 16-18 hours.
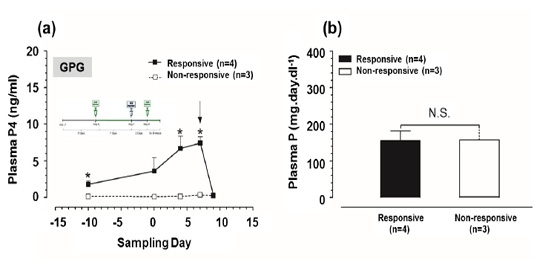
Plasma progesterone (P4) and plasma phosphorus (P) concentrations in GPG-ovsynch-treated group. (a) Plasma P4 concentrations for both responsive and non-responsive groups. Zero (0) means day of first dose GnRH administration, and black arrow indicates day of PGF2α injection. (b) Plasma P concentrations for both responsive and non-responsive groups throughout the period of study. Asterisk means a significant difference at P<0.05. N.S. means non-significant difference. All values are presented as mean ± SEM.
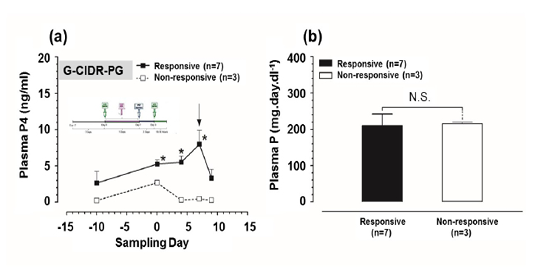
Plasma progesterone (P4) and plasma phosphorus (P) concentrations in G-CIDR-PG-modified ovsynch-treated group. (a) Plasma P4 concentrations for both responsive and non-responsive groups. Zero (0) means day of first dose GnRH administration, and black arrow indicates day of PGF2α injection. (b) Plasma P concentrations for both responsive and non-responsive groups throughout the period of study. Asterisk means a significant difference at P<0.05. N.S. means non-significant difference. All values are presented as mean ± SEM.
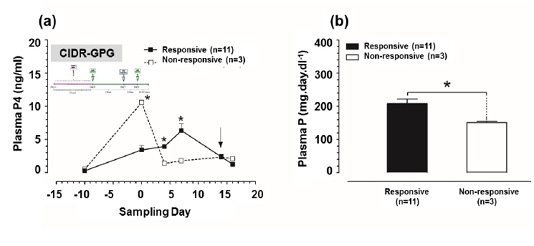
Plasma progesterone (P4) and plasma phosphorus (P) concentrations in CIDR-GPG-modified ovsynch-treated group. (a) Plasma P4 concentrations for both responsive and non-responsive groups. Zero (0) means day of first dose GnRH administration, and black arrow indicates day of PGF2α injection. (b) Plasma P concentrations for both responsive and non-responsive groups throughout the period of study. Asterisk means a significant difference at P<0.05. All values are presented as mean ± SEM.


