Advances in Animal and Veterinary Sciences
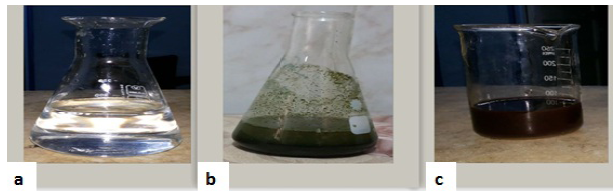
Formation of the dark brown AgNPs after adding algal ethanolic extract. (a) represents the clear AgNO3 (0.001M) solution. (B) represents the algal ethanolic extract. (C) Biosynthesized AgNPs.
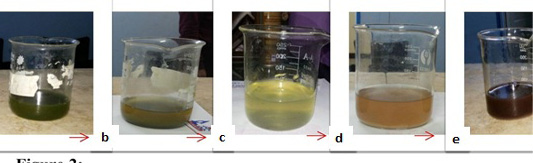
Dark brown color of the biosynthesized AgNPs with time. (a) represents the clear U. fasciata ethanolic extract. (b) represents greenish yellow color at once after adding 10 ml of algal extract to 90 ml 0.001 M of AgNO3 at room temperature. c: represents yellowish color. (d) represents brownish color. (e) represents the solutions that change gradually till become dark brown color which indicates the formation of AgNPs with the time.
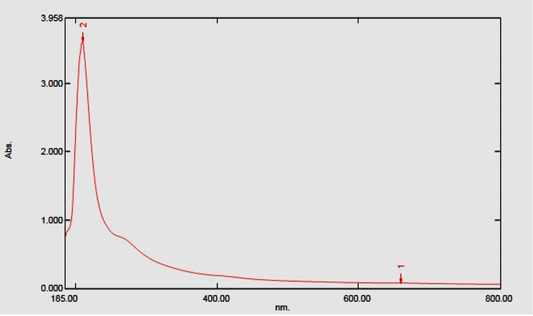
UV-visible range spectra of AgNPs synthesized by U. fasciata ethanolic extract.
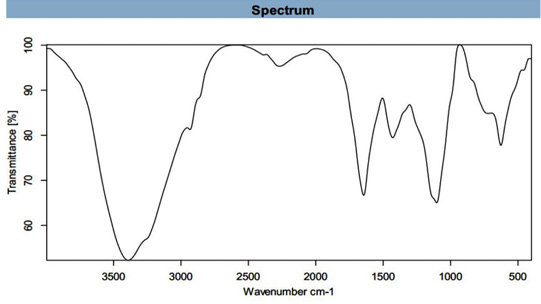
FT-IR spectrum show the functional groups response of U. fasciata ethanolic extract.
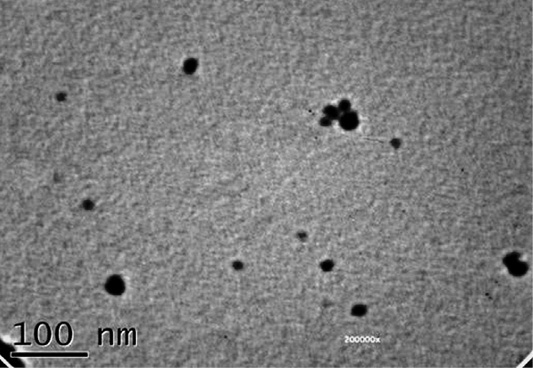
Representative TEM micrograph AgNPs synthesized by the reduction of AgNO3 ions in U. fasciata ethanolic extract.
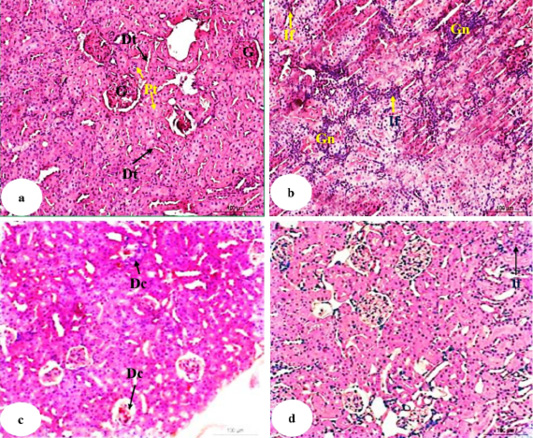
Photomicrographs of HandE stained kidney sections of normal (a), doxorubicin-administered group (b) and doxorubicin-administered groups treated with U. fasciata (c) and AgNPs/U. fasciata (d). G: glomeruli; Pt: proximal tubule; Dt: distal tubule; Gn: glomerulonephrosis; If: inflammatory cells infiltration; Dc: degenerative changes in glomeruli (with hypocellularity) and in tubules.
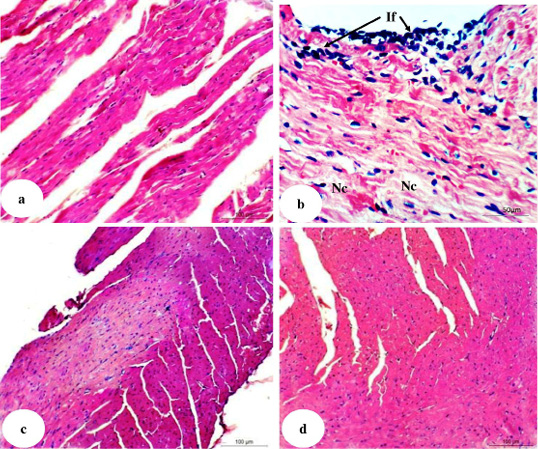
Photomicrographs of H and E stained heart sections of normal (7a), doxorubicin-injected group (7b) and doxorubicin-injected groups treated with U. fasciata (7c) and AgNPs / U. fasciata (7d). If: mononuclear inflammatory cells infiltration in the pericardium and between cardiomyocytes; and Nc: necrosis.


