Advances in Animal and Veterinary Sciences
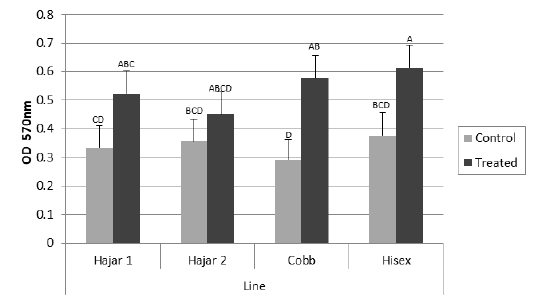
Mean optical density (OD) values of reduced MTT formazan for peripheral blood lymphocytes of different chicken lines stimulated with PHA (50 μg/ml) at 7d of the experiment. a, b, c, d columns with different superscript differ significantly (P ≤0. 05). Treated and control are injected and non-injected groups using cytokine- rich supernatant respectively.
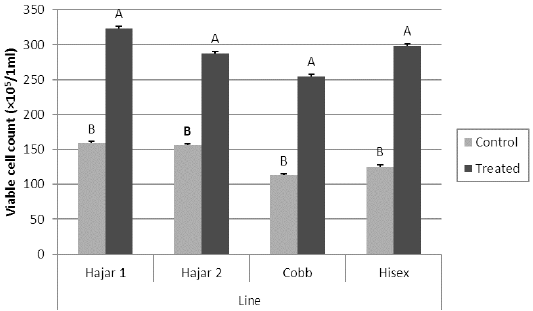
Viable cell count for peripheral blood lymphocytes of different chicken lines stimulated with PHA (50 μg/ml) at 7d of the experiment. a, b columns with different superscript differ significantly (P ≤0. 05). Treated and control are injected and non-injected groups using cytokine- rich supernatant respectively.
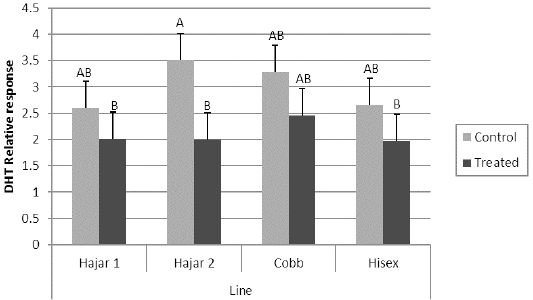
Delayed hypersensitivity test (DHT) relative response to Bovine serum albumin (BSA) of different chicken lines. a, b columns with different superscript differ significantly (P ≤0. 05). Treated and control are injected and non-injected groups using cytokine- rich supernatant respectively.


