South Asian Journal of Life Sciences
Research Article

Detection and Validation Studies of Trace Metals, Protein and Steroid in Different Organs of Local and Brand Meat (Poultry, Cattle and Fish)
Amina Arif1, Bushra Khan2, Narjis Shahid2, Rafique Ahmed3*
1Faculty of Life Sciences, University of Central Punjab 1-Khayaban-E-Jinnah Road, Johar Town, Lahore 54000 Pakistan; 2Lahore College for Women University, Lahore 54000 Pakistan; 3Govt. Kot Khawaja Saeed Teaching Hospital, Lahore, Pakistan.
Abstract | Present study was conducted to investigate the concentration of heavy metals (Na, K, Fe, Zn, Cu, Ni, Mg, Co, Cd and Pb) in different organs (heart, liver, muscles, wings, neck) of poultry, cattle (mutton, beef) and fish available in local and branded markets of Lahore. Atomic Absorption Spectroscopy and Flame Photometry were used to estimate the contamination of these metals in meat. The concentration of heavy metals in different organs showed great variation. The detected values of Na, K, Fe, Mg and Ni were under the tolerable level cited by international standards; World Health Organization (WHO) and Australia New Zealand Food Authority (ANZFA). The Co, Cd and Pd were almost absent in red meat samples but poultry meat wing samples had high concentration of Cu exceeding the permissible limits. Rapid and sensitive Lowry method was adopted for scrutinizing the protein content in internal organs (heart, liver, breast, wings, neck and leg) of poultry meat (Home raised, Local, Zenith and Menu). The results showed that out of all the tested samples liver of Home raised chicken was a rich source of protein. Quantitative evaluation of steroid (testosterone) in chicken through High Performance Liquid Chromatography confirmed that the level of testosterone in different organs didn’t exceed the acceptable limit.
Keywords | Heavy metals, Steroid, Atomic Absorption Spectroscopy, Flame Photometry, and High Performance Liquid Chromatography.
Editor | Muhammad Nauman Zahid, Quality Operations Laboratory, University of Veterinary and Animal Sciences, Lahore, Pakistan.
Received | September 23, 2020 Accepted | October 11, 2020; Published | January 15, 2021
*Correspondence | Rafique Ahmed, Govt. Kot Khawaja Saeed Teaching Hospital, Lahore, Pakistan; Email: dr.rafiqueahmad@gmail.com
Citation | Arif A, Khan B, Shahid N, Ahmed R (2021). Detection and validation studies of trace metals, protein and steroid in different organs of local and brand meat (poultry, cattle and fish). S. Asian J. Life Sci. 9(1): 1-9.
DOI | http://dx.doi.org/10.17582/journal.sajls/2021/9.1.1.9
ISSN | 2311–0589
Copyright © 2021 Ahmed et al. This is an open access article distributed under the Creative Commons Attribution License, which permits unrestricted use, distribution, and reproduction in any medium, provided the original work is properly cited.
Introduction
The consumption of meat is gradually increasing all over the world because the meat items have become a major component of the diet of an average person (Ihedioha et al., 2014; Chan et al., 1995). The common perception about healthy food is that it should be free of all kinds of health risks and have deliciously good taste. The bioaccumulation of poisonous metals from anthropogenic pollution is a potential threat to human health. The major source (>90%) of metal contamination in human is via food as compared to other ways of exposure such as breathing and dermal contact (Zheng et al., 2007; Ihedioha et al., 2014). Being a serious health issue heavy metal investigation related to food has become of great significance (Narres et al., 1984; Akoto et al., 2014). The essential parts of meat like muscles, liver and kidneys are considered as a very regular source of Co, Cr, Cu, Mo, Mn, Se and Zn in the human diet. Pb is commonly considered as toxic (Jarzyńska and Falandysz, 2011).
Pb, Hg and Cd are characterized as possible carcinogens causing number of diseases especially heart, kidney, nervous system, blood as well as bone syndromes (Akoto et al., 2014; Pilarczyk, 2014) . Although some metals such as Zn, and Cu are required at low level, their excessive presence in food is of great concern because of their poisonous effects to humans and animals at relatively higher concentrations (Akoto et al., 2014). Content of Cu in normal human adult is 50-120 mg, but slightly higher than 15 mg causes nausea, sickness, diarrhea intestinal pain (Narres et al., 1984). Excess of contaminated metals resides in liver, a rich natural source of important elements, can cause health threats to regular consumers of liver (Adei and Forson-Adaboh, 2008). Some metals (aluminium, arsenic, cadmium, chromium, copper, mercury, nickel, lead, selenium, and antimony) played important role in bioavailability studies, given by the U.S. Environmental Protection Agency (Mahmoud and Abdel-Mohsein, 2015).
According to Hu, Y et al. (2018) chickens are usually raised in intensive farms, where on daily basis a variety of food additives are given to them that cause public health risk of the consumer. Nowadays, small fish are used as a source of protein to feed the poultry. Fish collected from contaminated areas could have concentration of Hg to undesirable levels in the poultry and ultimately in human. Even low level of Hg in poultry feed made of fish can cause Hg accumulation in their flesh exceeding up to 0.03 mg/kg (Shah et al., 2010). In the populated cities like Lahore, with increasing industrialization, more and more industrial waste gets accumulated in various regions and makes its passage through soil into animal body, especially, in liver, kidney and lean meat.
Purchase of meat from branded markets or from the roadsides is not the issue but applying food protection standards on a product is necessary as it co-relates strictly to human’s health (Sabir et al., 2003; Hamasalim and Mohammed, 2013). Mariam et al. (2004) conducted a study to determine the presence of selected trace elements in lean and organ meat of beef, mutton, poultry and fish; regular items of every day intake in human food. The quantity of heavy metals present in samples was normal. Data obtained from assessment did not indicate harmful effects on public health. (Falandysz, 1994; Chen et al., 2013).
Steroid hormones help control metabolism, immune functions, inflammation, water and salt balance as well as development of sexual characteristics. They also regulate diverse physiological processes in target tissues and play key role in quality growth of mammals (Sato and Iemitsu, 2015; Chen et al., 2015). Some of these anabolic steroids are excessively used in veterinary and as an abusive drug by humans (Mesmer and Satzger, 1997). The investigation of hormone used for growth promotion in food of animal is a matter of global concern (Costain et al., 2008). Some veterinary reports claim that excessive steroid hormones are present in meat because male chicken treated with sex steroid hormones for growth enhancement (Andersson and Skakkebaek, 1999). Sometimes to gain an economical profit banned drugs may be added to farm animals’ feed for promoting their muscle development which results as a fraudulent overweight chicken. The residues of these elements may retain in meat and may pose a real danger to the consumer either through exposure to the residues, transfer of antibiotic resistance or allergy risk. The use of growth promoters in cattle both alone and in combination with other anabolic hormones is banned by Europeon (Reig and Toldrá, 2008; Divari et al., 2011). Mesmer and Satzger, (1997) examined the anabolic steroids in samples by using high-performance liquid chromatography with ultraviolet-visible source. Blasco et al. (2007) used highly sensitive multi residue method for the determination of anabolic steroid residues in poultry muscle tissues. Although no recognized and formally validated limits of endogenous hormones, such as testosterone were found in tissues (Costain et al., 2008). But as meat is one of the valuable diet sources for humans therefore, concerns are increasing slowly about the safety of meat. (Shahbazi et al., 2016). It is the need of time that people should have the capacity to buy their daily intake diet by safe resources (Rehman et al., 2012).
Materials and Methods
The organ samples of heart, liver, muscles, wings and neck from white meat (Local and Home raised chicken), red meat (mutton and beef) and fish (muscles) were collected from Local and branded (Zenith, Menu) markets of Lahore. These samples were proceeded for estimation of heavy metals and minerals in meat.
Atomic Absorption Spectrophotometry
The meat samples (2.00 g) were predigested in 10 mL concentrated HNO3 at 135oC until the liquor was clear in a digestion tube. 10 mL HNO3, 1 mL HClO4 and 2 mL H2O2 were added to it maintaining the temperature at 135oC until the liquor became colourless. The digest was slowly evaporated to near dryness (avoiding prolonged baking), cooled and dissolved in 1M HNO3, filtered through Whatman filtre No 1 and diluted to 25 mL with 1M HNO3 (Iwegbue et al., 2008). The concentration of Cd, Pb, Mn, Ni, Cr, Fe and Zn was analyzed using graphite furnace atomic absorption spectrophotometry. 1, 2 and 3 ppm metal concentrations were used for the reference.
Flame Photometery
The quantification of alkali metals was done by flame photometer (Ghaedi et al., 2008). The Jenway Economical Flame Photometer 115 VAC 50/60 Hz was used for valuation of Na and K in samples. The system was calibrated with 2, 4, and 6 ppm K and Na solutions. The three working standards were run to acquire a straight line curve. The samples were subjected to the Bunsen flame. The Na metals at 589 nm emits perky yellow flame and K at 766 nm displays mauve color. The meat samples were prepared according to the method describes by da Silva et al. (2012) and subjected to flame photometer, the concentration of metal in every single sample was recorded.
Protein extraction
The protein estimation was done by modified Lowry’s protein assay (Esen, 1978). Bovine Serum Albumin (BSA) was used to make standard curve for the estimation of protein in the meat samples. Meat sample was ground well with pastel and mortar. 5 g sample was taken in the falcon tube, 5 mL phosphate buffer was added drop wise mixed it well then centrifuged at 5000 rpm for 5 minutes. Supernatant was used for protein quantification. 0.2 mL of a sample was taken in a test tube and volume was made up to 10 mL with distilled water. 5 mL of reagent A, B mixture was added to test tube and permitted to stand for 10 minutes then 0.5 mL folin reagent was added. After mixing effectively the samples were kept in the incubator at 37 Co for 30 minutes. Absorbance was taken at 660 nm.
Estimation of the growth hormones through High Performance Liquid Chromatography
5 g meat sample was sliced and homogenized. 5 mL of extraction solvent (acetic acid buffer in the mixture of polar solvent) was added and agitated well. 2 g of MgSO4 and 0.5 g of sodium acetate were added and contents were shaken well. About 50 mg of PSA (Primary secondary amine) was added and centrifuged at 4000 rpm for 5 minutes. Supernatant was analyzed for steroids through Reverse phase HPLC using C-18 column. Mobile phase was Methanol:Water (80:20). The flow rate was set at 1 mL/min and injection volume was 5 µL. Testosterone solution 100 mg/mL methanol was prepared out of that 1, 2.5, 5 and 10 µL were injected as reference. UV detector was used to detect the wavelength of 245 nm.
Statistical analysis
The data was analyzed by using Excel data sheets. Percentages as well as mean values + SD of the heavy metals were calculated.
Results
The results were compiled on the basis of analysis performed to estimate the concentration of above mentioned metals present in different organs of chicken, mutton, beef and fish given in Table 1 to 4.
The lowest amount of sodium (Na) 0.86 ± 0.01 ppm was found in chicken muscle while the highest 5.96 ± 0.01 ppm was observed in mutton heart sample. Mutton liver contained 1.87 ± 0.01 ppm sodium while beef liver 5.41 ± 0.01 ppm. The mean value of Na in fish was 73 ± 1.63 ppm.
The highest concentration of potassium (K) was detected in fish samples that was 104 ± 1.63 ppm. Local chicken liver contained 12.56 ± 0.01 ppm - 11.46 ± 0.01 ppm potassium while Branded chicken (Zenith, Menu) contained 3.16 ± 0.01 ppm and 3.07 ± 0.01 ppm potassium respectively.
The concentration of iron (Fe) in heart sample of Local chicken was 6.28 ± 0.02 ppm and in Home raised chicken 6.5 ± 0.01 ppm. A piece of Home raised chicken liver contained 3.96 ± 0.008 ppm iron. In Muscles of Zenith mutton the Fe concentration was 3.43 ± 0.17 ppm as compare to Menu mutton 4 ± 0.81 ppm. Every tested part of beef (heart, liver and muscle) showed almost same Fe content ranged from 3.43 ± 0.01 ppm to 4.46 ± 0.01 ppm. The fish sample exhibited good storage of iron in muscle organ.
Copper (Cu) was extensively determined in meat samples. Amount of copper was highest in chicken wings 3.16 ± 0.01 and lowest in mutton muscles 0.1 ± 0.01 ppm. The amount of zinc (Zn) in all collected samples indicated that highest concentration of zinc was present in beef liver that was 7.55 ± 0.01 ppm while lowest concentration 0.85 ± 0.02 ppm in beef muscles. Home raised chicken, different organs’ Zn contents ranged 3.03 ± 0.02 ppm to 3.14 ± 0.02 ppm. Zn in the fish samples was up to 3.56 ± 0.01 ppm.
The Magnesium Mg highest concentration in beef muscle was 12.34 ± 0.01 ppm while the lowest in Beef heart that was 0.63 ± 0.02 ppm. Highest Mg content in mutton was 7.95 ± 0.02 ppm while lowest 0.16 ± 0.01 ppm. Amount of Mg in chicken samples showed variation. The highest Mg content was observed in Local chicken heart 5.33 ± 2.05 ppm and 0.58 ± 0.01 ppm in liver. The mean values of Mg in fresh, Zenith and Menu sample of fish were 33.33 ± 1.25 ppm, 35 ± 1.63 ppm and 32.63 ± 0.12 ppm, respectively
The heart samples had approximately closer value of nickel (Ni) in chicken, mutton and beef which was about 0.21 ± 0.01 ppm. The highest and lowest amounts of Ni 0.26 ± 0.01 ppm and 0.21 ± 0.01 ppm were recorded for all liver samples.
Lead (Pb) was not detected in liver and muscle of poultry samples. Local chicken wing tissues had Lead concentration 0.18 ± 0.008 ppm remaining samples had value less than this. The value of Pb in fish was 0.13 ± 0.02 ppm. The highest detectable amount of Cobalt (Co) present in chicken liver was 0.006 ± 0.001 ppm while it was absent in all samples of fish. There was no cadmium (Cd) content observed during analysis of poultry and cattle meat heart and liver. The highest Cd concentration 0.05 ± 0.01 ppm was recorded in the poultry neck samples while 0.006 ±
Table 1a: Concentration of metals in different organs of Chicken (Zenith, Menu, Local, and Home raised)
| Metals | Chicken Heart | Chicken Liver | Chicken Muscles | |||||||||
| Zenith | Menu | Local | Home raised | Zenith | Menu | Local | Home raised | Zenith | Menu | Local | Home raised | |
|
Mean ±S.D |
Mean ±S.D |
Mean ±S.D |
Mean ±S.D |
Mean ±S.D |
Mean ±S.D |
Mean ±S.D |
Mean ±S.D |
Mean ±S.D |
Mean ±S.D |
Mean ±S.D |
Mean ±S.D |
|
| Na |
2.37± 0.02 |
2.40± 0.01 |
2.14± 0.02 |
2.16± 0.01 |
1.54± 0.01 |
1.26± 0.008 |
0.96± 0.01 |
1.94± 0.02 |
0.98± 0.008 |
0.88± 0.008 |
0.96± 0.01 |
0.86± 0.01 |
| K |
8.20± 0.01 |
8.55± 0.01 |
8.36± 0.02 |
8.45± 0.02 |
12.56± 0.01 |
11.66± 0.12 |
11.84± 0.02 |
11.46± 0.01 |
10.96± 0.01 |
11.85± 0.02 |
12.96± 0.01 |
11.86± 0.01 |
| Fe |
6.40± 0.01 |
6.5± 0.01 |
6.28± 0.02 |
6.5± 0.01 |
11.36± 0.01 |
11.46± 0.01 |
11.56± 0.01 |
12.26± 0.01 |
3.25± 0.02 |
3.57± 0.008 |
2.15± 0.02 |
2.31± 0.02 |
| Cu |
0.25± 0.01 |
0.22± 0.01 |
0.25± 0.02 |
0.4± 0.16 |
1.45± 0.02 |
1.54± 0.02 |
1.48± 0.01 |
1.58± 0.01 |
0.29± 0.01 |
0.26± 0.01 |
0.18± 0.02 |
0.26± 0.01 |
| Zn |
2.21± 0.02 |
2.24± 0.01 |
2.26± 0.01 |
4.49± 0.01 |
4.35± 0.01 |
4.34± 0.01 |
4.76± 0.01 |
4.56± 0.01 |
3.48± 0.02 |
3.63± 0.12 |
3.50± 0.02 |
1.21± 0.02 |
| Mg |
2.93± 0.03 |
3.94± 0.01 |
5.33± 2.05 |
3.56± 0.01 |
0.65± 0.02 |
0.64± 0.01 |
0.58± 0.01 |
0.61± 0.02 |
1.46± 0.01 |
1.66± 0.12 |
1.49± 0.01 |
1.93± 0.03 |
| Ni |
0.14± 0.01 |
0.14± 0.01 |
0.13± 0.02 |
0.14± 0.02 |
0.26± 0.01 |
0.24± 0.02 |
0.24± 0.01 |
0.22± 0.01 |
0.16± 0.01 |
0.14± 0.02 |
0.15± 0.02 |
0.15± 0.02 |
| Pb |
0.0002± 0.0001 |
0.0002± 0.0001 |
0.0003± 0.0002 |
0.0003± 0.0002 |
ND | ND | ND | ND | ND | ND | ND | ND |
| Co | ND | ND |
0.001± 0.0002 |
ND |
0.004± 0.001 |
0.006± 0.001 |
0.004± 0.001 |
0.004± 0.001 |
0.004± 0.004 |
0.006± 0.001 |
0.005± 0.002 |
0.005± 0.002 |
| Cd | ND | ND | ND | ND | ND | ND | ND | ND |
0.006± 0.006 |
0.005± 0.001 |
0.005± 0.001 |
0.006± 0.002 |
Amounts are given in ppm; S.D means standard deviation; ND means not detected
Table 1b: Concentration of metals in different organs of Chicken (Zenith, Menu, Local and Home raised)
| Metals | Chicken Wings | Chicken neck | ||||||
| Zenith | Menu | Local | Home raised | Zenith | Menu | Local | Home raised | |
| Mean±S.D | Mean±S.D | Mean±S.D | Mean±S.D | Mean±S.D | Mean±S.D | Mean±S.D | Mean±S.D | |
| Na | 2.48±0.008 | 2.77±0.01 | 2.84±0.01 | 3.95±0.01 | 2.16±0.01 | 2.06±0.01 | 1.7±0.08 | 1.76±0.01 |
| K | 11.17±0.008 | 11.59±0.01 | 11.17±0.01 | 10.20±0.01 | 3.16±0.01 | 3.07±0.01 | 2.76±0.12 |
3.76±0.01 |
| Fe | 5.56±0.20 | 5.17±0.01 | 5.65±0.02 | 5.46±0.01 | 3.27±0.01 | 3.26±0.008 | 3.63±0.16 | 3.96±0.008 |
| Cu | 3.16±0.01 | 1.07±0.01 | 3.06±0.01 | 1.35±0.01 | 0.25±0.008 | 0.43±0.26 | 0.73±0.16 |
0.36±0.01 |
| Zn | 2.97±0.01 | 3.05±0.02 | 3.47±0.008 | 3.06±0.01 | 3.14±0.02 | 3.14±0.01 | 3.13±0.02 | 3.03±0.02 |
| Mg | 1.43±0.28 | 1.05±0.02 | 0.97±0.01 | 1.17±0.01 | 2.24±0.02 | 2.14±0.02 | 2.47±0.49 |
2.04±0.02 |
| Ni | 0.14±0.01 | 0.16±0.01 | 0.14±0.02 | 0.14±0.02 | 0.07±0.01 | 0.07±0.01 | 0.07±0.01 | 0.06±0.02 |
| Pb | 0.14±0.02 | 0.14±0.02 | 0.18±0.008 | 0.06±0.02 | 0.04±0.02 | 0.05±0.02 | 0.04±0.01 |
0.05±0.02 |
| Co | ND | ND | ND | ND | ND | ND | ND | ND |
| Cd | 0.05±0.01 | 0.04±0.01 | 0.04±0.02 | 0.04±0.01 | ND | ND | ND |
ND |
Amounts are given in ppm; S.D means standard deviation; ND means not detected
Table 2: Concentration of metals in different organs of Mutton (Zenith, Menu and Fresh)
| Metals | Mutton Heart | Mutton Liver | Mutton Muscles | ||||||
| Zenith | Menu | Fresh | Zenith | Menu | Fresh | Zenith | Menu | Fresh | |
|
Mean ±S.D |
Mean ±S.D |
Mean ±S.D |
Mean ±S.D |
Mean ±S.D |
Mean ±S.D |
Mean ±S.D |
Mean ±S.D |
Mean ±S.D |
|
| Na | 5.96±0.01 | 6.53±0.20 | 6.4±0.24 | 2.16±0.01 | 1.95±0.02 | 1.87±0.01 | 5.14±0.02 | 5.14±0.02 | 5.26±0.01 |
| K | 3.36±0.20 | 2.63±0.12 | 2.43±0.25 | 7.15±0.02 | 6.96±0.02 | 7.45±0.02 | 6.15±0.02 | 6.19±0.02 |
6.27±0.04 |
| Fe | 4.13±0.02 | 3.45±0.02 | 3.47±0.04 | 5.14±0.01 | 4.57±0.02 | 4.13±0.01 | 3.43±0.17 | 4±0.81 | 3.63±0.20 |
| Cu | 0.16±0.01 | 0.13±0.01 | 0.18±0.02 | 0.14±0.02 | 0.22±0.01 | 0.15±0.02 | 0.54±0.02 | 0.1±0.01 | 0.27±0.01 |
| Zn | 4.82±0.01 | 6±1.63 | 4.40±0.02 | 4.06±0.02 | 4.83±0.01 | 4.56±0.01 | 3.94±0.01 | 3.95±0.02 | 3.45±0.02 |
| Mg | 0.95±0.01 | 0.89±0.01 | 0.16±0.01 | 7.95±0.02 | 7.45±0.02 | 7.37±0.01 | 4.15±0.02 | 4.56±0.02 | 6.13±0.02 |
| Ni | 0.17±0.01 | 0.15±0.02 | 0.16±0.01 | 0.23±0.02 | 0.24±0.02 | 0.24±0.01 | 0.24±0.02 | 0.27±0.01 | 0.15±0.01 |
| Pb |
0.007± 0.01 |
0.005± 0.003 |
0.006± 0.002 |
ND | ND | ND | ND | ND |
0.005± 0.002 |
| Co | ND | ND | ND |
0.004± 0.001 |
0.002± 0.001 |
0.003± 0.001 |
ND | ND | ND |
| Cd | ND | ND | ND | ND | ND | ND |
0.004± 0.002 |
0.006± 0.002 |
0.005± 0.001 |
Amounts are given in ppm; S.D means standard deviation; ND means not detected
Table 3: Concentration of metals in different organs of Beef (Zenith, Menu and Fresh)
| Metals | Beef Heart | Beef Liver | Beef Muscles | ||||||
| Zenith | Menu | Fresh | Zenith | Menu | Fresh | Zenith | Menu | Fresh | |
|
Mean ±S.D |
Mean ±S.D |
Mean ±S.D |
Mean ±S.D |
Mean ±S.D |
Mean ±S.D |
Mean ±S.D |
Mean ±S.D |
Mean ±S.D |
|
| Na | 1.36±0.01 | 1.55±0.02 | 1.13±0.01 | 5.92 ±0.01 |
5.41±0.01 | 5.37± 0.008 |
1.14±0.01 | 1.46±0.01 | 0.96 ±0.01 |
| K | 3.55±0.01 | 3.95±0.008 | 3.23±0.01 | 3.12 ±0.01 |
2.95±0.01 | 2.38± 0.02 |
4.14±0.01 | 2.94±0.01 | 4.95 ±0.01 |
| Fe | 4.4±0.24 | 3.43±0.01 | 3.47±0.01 | 4.44 ±0.01 |
4.34±0.01 | 3.97± 0.008 |
4.46±0.01 | 4.36±0.01 | 3.97 ±0.01 |
| Cu | 0.46±0.01 | 0.46±0.01 | 0.45±0.02 | 0.85 ±0.02 |
0.53±0.02 | 0.43± 0.008 |
0.52±0.01 | 0.43±0.02 |
0.34 ±0.01 |
| Zn | 2.3±0.16 | 1.88±0.008 | 1.7±0.12 | 7.55 ±0.01 | 5.62±0.02 | 7.47± 0.008 |
0.97±0.02 | 0.85±0.02 | 2.33 ±1.24 |
| Mg |
0.96± 0.008 |
0.88±0.01 | 0.63±0.02 |
11.63± 0.02 |
11.34± 0.01 |
11.85 ±0.008 |
12.13±0.01 | 12.34±0.01 | 10.14 ±0.02 |
| Ni | 0.32±0.01 | 0.43±0.01 | 0.22±0.01 | 0.25 ±0.01 |
0.26±0.01 | 0.24± 0.01 |
0.15±0.008 | 0.16±0.01 | 0.15 ±0.01 |
| Pb | 0.06±0.01 | 0.04±0.01 | 0.04±0.16 | ND | ND | ND | ND | ND | 0.002 ±0.01 |
| Co | ND | ND | ND |
0.003 ±0.001 |
0.004 ±0.001 |
0.005 ±0.002 |
ND | ND | ND |
| Cd | ND | ND | ND | ND | ND | ND | ND | ND |
ND |
Amounts are given in ppm; S.D means standard deviation; ND means not detected
Table 4: Concentration of metals in different organs of Fish (Zenith, Menu and Fresh)
| Sr# | Muscles of Fish | |||
|
Metals Mean±S.D |
Zenith Mean±S.D |
Menu Mean±S.D |
Fresh Mean±S.D |
|
| 1 | Na | 73±1.63 | 71±1.63 | 68.33±1.25 |
| 2 | K | 102±2.51 | 104±1.63 | 103±1.63 |
| 3 | Fe | 11.7±0.16 | 11.4±0.16 | 13.66±2.08 |
| 4 | Cu | 0.42±0.02 | 0.37±0.008 | 0.35±0.02 |
| 5 | Zn | 3.42±0.02 | 3.37±0.01 | 3.56±0.01 |
| 6 | Mg | 35±1.63 | 32.63±0.12 | 33.33±1.25 |
| 7 | Ni | 0.15±0.02 | 0.14±0.01 | 0.14±0.02 |
| 8 | Pb | 0.13±0.02 | 0.13±0.01 | 0.13±0.01 |
| 9 | Co | ND | ND | ND |
| 10 | Cd | 0.087±0.002 | 0.091±0.002 |
0.06±0.01 |
Amounts are given in ppm; S.D means standard deviation; ND means not detected
0.002 ppm in mutton. Cd was totally absent in beef samples.
Protein estimation
The comparative study of the meat protein samples is shown in Figure 1. Liver of Home raised chicken was rich in protein that was 38 mg/g. Home raised chicken had 23 mg/g while Local, Zenith and Menu had 22.5 mg/g, 20 mg/g and 15 mg/g respectively. Home raised chicken had 21.7 mg/g protein in heart sample. Wings sample of Local, Zenith and Menu had approximately closer protein concentration. The lowest amount of protein was estimated in chicken neck.
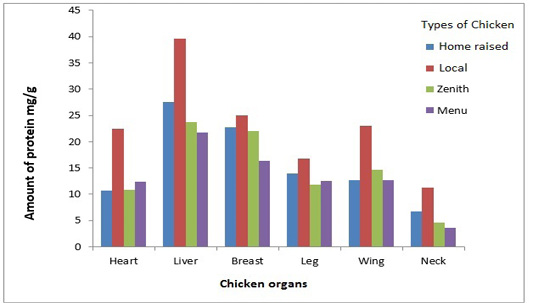
Amount of protein in different organs of the chicken taken from Home raised, Local, Menu and Zenith is shown. All the organs taken from the Home raised chicken contained more protein compared to the organs taken from other chicken samples. Whereas liver of the Home raised chicken contained maximum amount of protein in comparison to all the samples.
Estimation of the growth hormones
The concentration of testosterone as detected through HPLC in organs of chicken both Local and Home raised has been compiled in the Table 5. The maximum concentration of steroid was present in Home raised chicken’s neck sample that was1.14 µg/kg.
Table 5: Concentration of testosterones in different organs of Local and Home raised Chicken
| Sr# | Organs | Concentration of Testosterons (µg/kg) | |
|
Local Mean±S.D |
Home raised Mean±S.D |
||
| 1 | Leg | 0.07±0.01 | 0.015±0.002 |
| 2 | Breast | 0.04±0.02 | 0.05±0.02 |
| 3 | Neck | 1.05±0.03 | 1.14±0.01 |
| 4 | Wings | 0.25±0.02 | 0.85±0.01 |
Discussion
A study was carried out to quantify the heavy metal (Na, K, Fe, Mg, Zn, Cu, Co, Cd, Pb and Ni) in different organs (Heart, liver, muscles, neck and wings) of poultry, cattle and fish. The detected amounts were compared with the Joint FAO/WHO Expert Committee on Food Additives (JECFA) standards (Joint et al., 2006).
The maximum amount of Na 73±1.63 ppm was found in fish sample belonging to Zenith brand while the second maximum amount of this metal was found in the Menu mutton heart that was 6.53±0.20 ppm. Similar result was reported by Capra, (2006). Maximum amount of K 103±1.63 ppm was detected in the fresh fish muscle. All other samples also contained reasonable amount of Potassium.
Certain metallic cations such as copper and iron also contribute considerably to female reproductive activities (Agarwal et al., 2008). To consume a liver once a week in order to fulfill Fe demand was confirmed by this analysis, and also by other researchers; Chicken and beef liver contained 9.2 mg/kg and 4.8 mg/kg of iron respectively (MacLeod, 2009). According to our study Home raised chicken liver 12.26±0.01 mg/kg and fresh fish muscle 13.66±2.08 mg/kg are the good sources of iron. Likewise reported by Demirezen and Uruç (2006).
Provisional maximum tolerable daily intake (PMTDI) of copper is 0.5 mg/kg body weight (Ysart et al., 2000) as recommended by JECFA. Amount of Cu in all meat samples was up to the recommended range only chicken wings were found to contain more copper that was 3.16±0.01 ppm. Important zinc providing supplements are meat stuff, fish and poultry (Mahmoud and Abdel-Mohsein, 2015). According to our study maximum amount of Zn was detected in heart and liver samples. Freshly slaughtered beef liver was found to be the best source of Zn that was 7.47±0.008 ppm.
Magnesium in Zenith fish was 35±1.63 ppm. Second maximum Mg containing sample was freshly slaughtered beef liver 11.85±0.008 ppm. Exceptional amount of Mg was found in the beef heart, liver and muscles. Nickel compounds being carcinogenic induce of kidney and lung tumors, cause genotoxicity and oxidative stress through the generation of reactive oxygen species (Mahmoud and Abdel-Mohsein, 2015).
González-Weller et al. (2006) determined the levels of Pb and Cd in chicken, pork, beef, lamb and turkey samples (both meat and meat products), collected from the island of Tenerife (Spain). Statistically significant differences were found for Pb content in meat samples. In our research among all the samples analyzed maximum amount of Pb was 0.18±0.008 ppm detected in the local chicken wings. Even fish samples contained amount of lead less than the present in the chicken wings.
Cadmium has capacity to accumulate in the kidneys efficiently and having biological half-life for humans 20-30 years (Goering et al., 1995). The concentration of Cd was alarming in the all fish samples 60-91 µg /kg. The Joint FAO/WHO Expert Committee on Food Additives established a provisional tolerable monthly intake of 25 µg/kg (Meeting and Organization, 2013) The maximum detected value of Cobalt was 0.006±0.001 in chicken muscle and liver samples. In a research conducted by Koréneková et al. (2002) the occurrence of heavy metals was determined in the biological material of cattle reared in agricultural farms in the fallout region of a metallurgical plant. The metal values reported in our research are comparatively less than reported by Koréneková et al. (2002) confirming that the environment of animals rearing counts for the accumulation of the metals in the meat.
In a study conducted by Jarić et al., (2011) the concentrations of Ag, Al, As, B, Ba, Cd, Co, Cr, Cu, Fe, Mn, Mo, Ni, Pb, Se, Sr, Zn and Li were determined in the muscle, gills, liver and intestine of the starlet from the Danube River. Heavy metal concentrations in the fish muscle were at acceptable levels for human consumption, except for cadmium in accordance to the data reported here.
The Home raised chicken had more protein than Local chicken neck. Level of decreasing protein quantity was Home Raised >Local >Menu>Zenith 10g/kg > 5g/kg > 3.5g/kg > 3g/kg respectivly. From these results it has been estimated that Home raised chicken is far better and extraordinary protein source. The Local chicken purchased from roadside is also a reliable meat to eat. The branded chicken (Zenith, Menu) had slightly less protein.
Regular intake of commercial chicken meat can lead to variations in sex hormones. (Ahmad et al., 2017). Blackwell et al. (2015) conducted a research for quantitative examination of steroid as growth promoters. Our study is also focusing on the emerging issue of abusive use of hormones in the Local chicken. All the specimens (Local chicken, Home raised) were processed and analyzed very carefully no sample exceeded the limit of testosterone (sex hormone) steroids concentration.
Conclusion
The major objective of this research was to quantify the heavy metals in meat samples (poultry, cattle and fish). It is concluded that determined values of Na, K, Fe, Mg, Ni showed great variations but were under the tolerable levels cited by international standards. The Co, Cd and Pd were absent in most of the meat samples but Local chicken, Menu and Zenith wings sample had high concentration of Zn and Cu. As far as protein concentration is concerned the liver and breast piece of chicken may serve as a best choice to fulfill protein needs of body. The neck and wings have very less protein content as compared to other organs of chicken. The results of the testosterone estimation showed that chicken is safe to consume as no growth hormones was detected above the permissible limit. Home raised chicken is always recommended as the best meat for consumption because of the natural protein producer and being exposed to less contaminated environment in turn having very less chances of heavy metals accumulation. Insecticides are frequently used by workers for cleaning out poultry sheds that cause the environmental pollution and some heavy metal accumulation in the meat (Vaughan, 1999).
acknowledgements
We acknowledge Lahore College for Women University for providing labs, chemicals and instruments for the accomplishment of the present project.
conflict of interest
There are no conflict of interests.
authors contribution
AA Planed the research, BK Provided place and material, NS Performed the experiments, RA Wrote the article.
References